
Work like a pro with this functions
MktCompass is an easy-to-use GIS web tool.
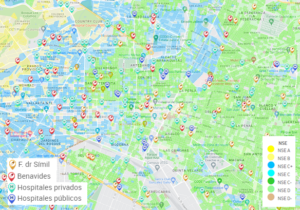
Map layers and points
MktCompass allows you to color the map using all available pro data, and display specific venues from our database. In the collage image, the map is colored by predominant household income level, with the locations of hospitals and two drugstores franchises highlighted.
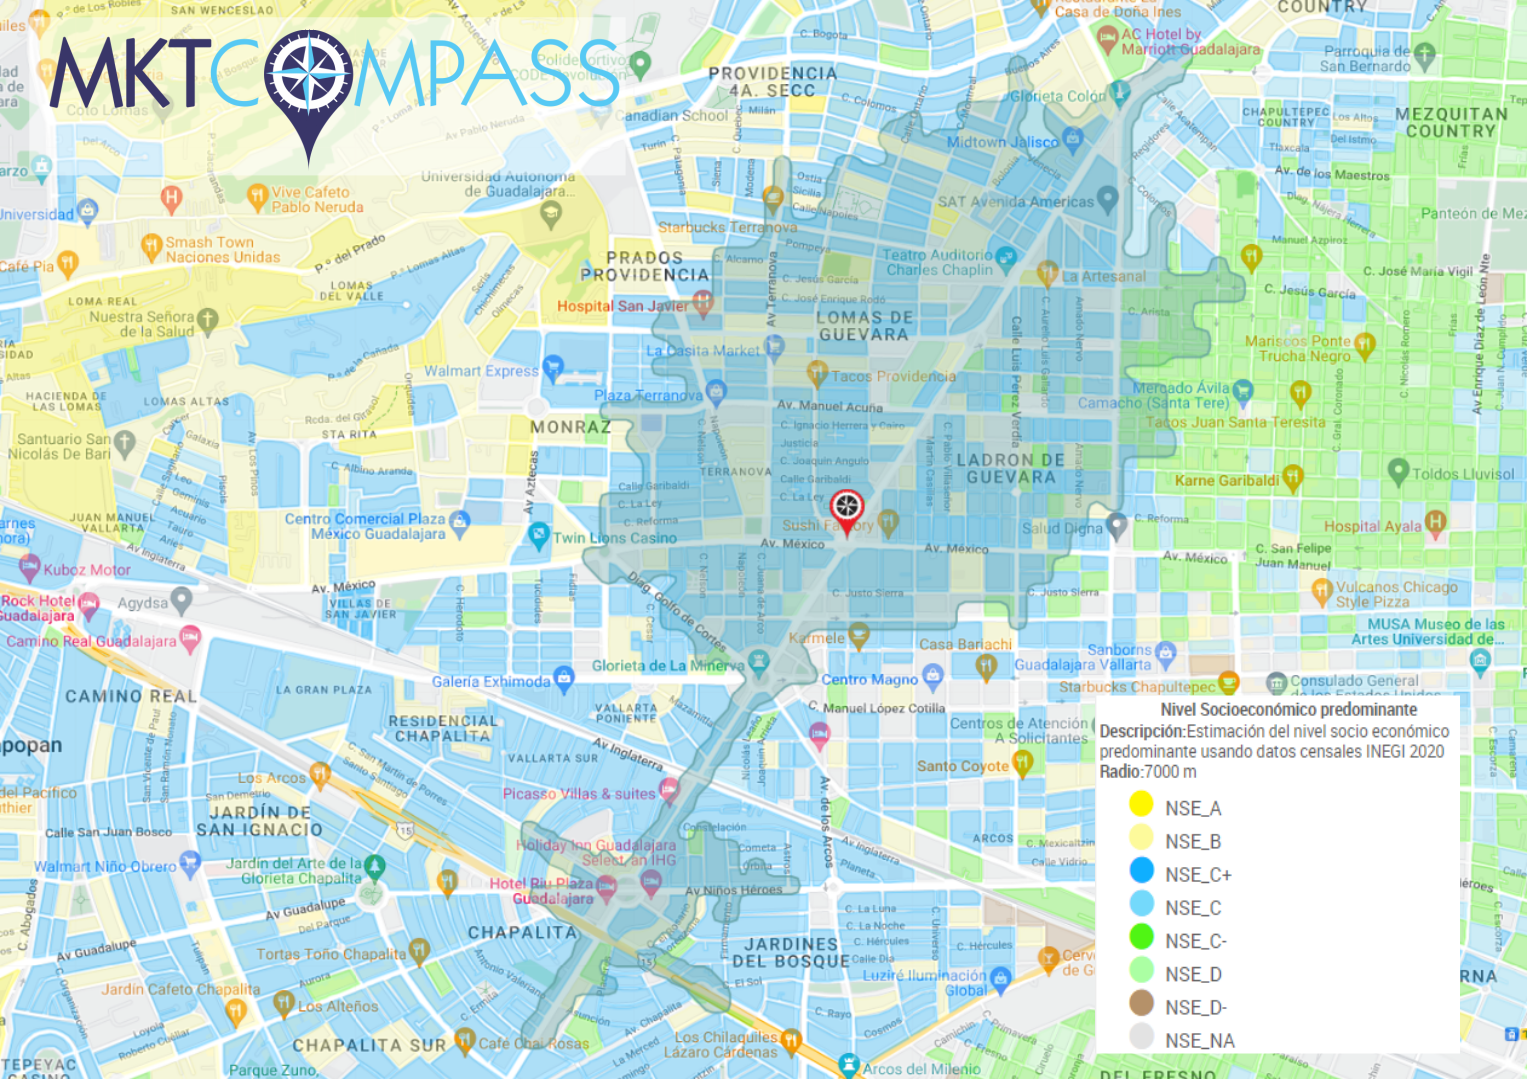
Create isolines and analyze area
MktCompass Pro license enables you to create time-travel based areas (isolines) and obtain a basic or comprehensive report about them. This image is an example of a isoline.
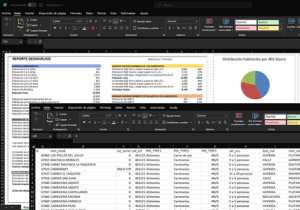
Report and export
Quickly obtain a full professional report of any area and export it to a standard XLSX report. You can create a database of venues or companies in the area. The image is a collage of sheets from the XLSX report.
Unlock the Power of MktCompass Pro Today!
Access the MktCompass complete geodatabases.
The MktCompass database contains the most reliable and up-to-date information from official censuses of Canada, Mexico, and the USA, including both demographic and economic data. The maps and data are organized by country, state or province, and urban areas. The data is further enriched with information from private sources and property MktCompass data.
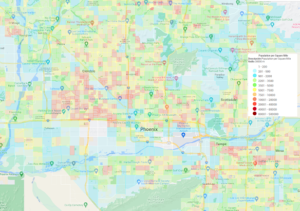
Demographic data
MktCompass allows you to map total population, population density (per square mile or square km), population growth, and demographics such as age, gender, race, and more.
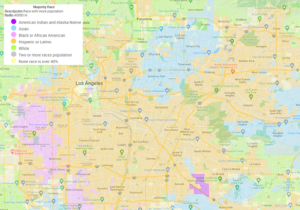
Population profile
The census offices of Canada, Mexico, and the US provide detailed descriptions of population characteristics, including age, gender, race, and many other statistics.
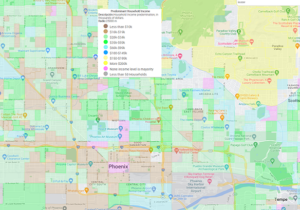
Household income
MktCompass enables you to map economic data of the population, including the predominant income level for households, average income level, income distribution, and many other variables.
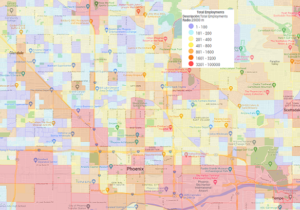
Employment
Additionally, you can map data related to economic activity, such as total employment, employment by income level, employment in commerce and personal services, total number of workplaces and by industry, and many others.
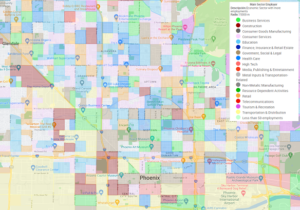
Economic vocation
This map visualizes the primary industry sectors that generate employment in different zones of the city. The blue areas indicate the prevalence of health services, while the orange areas indicate a dominance of commerce and personal services. Other colors represent other sectors, each highlighting the distinctive economic landscape of the city.
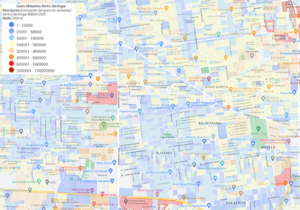
Consumption potential
MktCompass allows for the estimation of consumption potential for specific categories or products in urban areas. In this case, the map displays the potential consumption for coffee shops.